Interest
Interest is an analytics extension that provides contextual visualization of your interest position.
Do note that all the charting in this extension are based on the current savings amount at the month or year selected, not the historical amount that are in these accounts. The figures are only useful if you're just starting out with interest assessments, if the amount saved in these savings did not change drastically for the period that is in scope and/or if you're aware of the changes made and are using these visualization to analyse the impact of changes.
Date scope and annualization
The annualized figure in this extension is calculated on a pro rata basis, based on the month or year in scope. If the year in scope is the current year, the pro-rata is calculated based on actual current month. For previous years, there's no pro-ration as the entire year's interest is considered.
Summary view

The summary view shows the actual interest that is received for the period that you chose.
These percentages are calculated by summing up all of the interest that had been received in the interest income account (default: Interest:Income).
Detailed view
There are 4 charts in the detailed view.
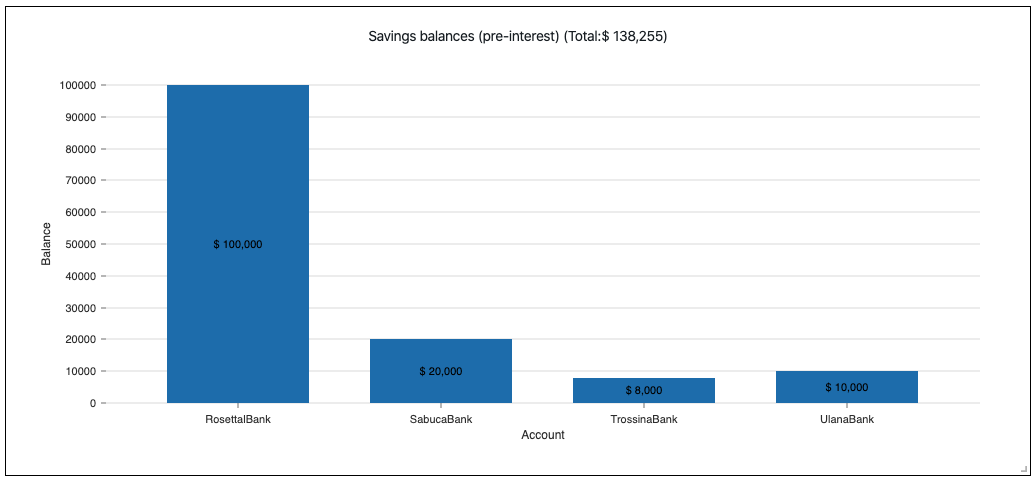
Savings balances (pre-interest)

This chart shows you the current balance that is in your savings accounts (default: Assets:Savings).
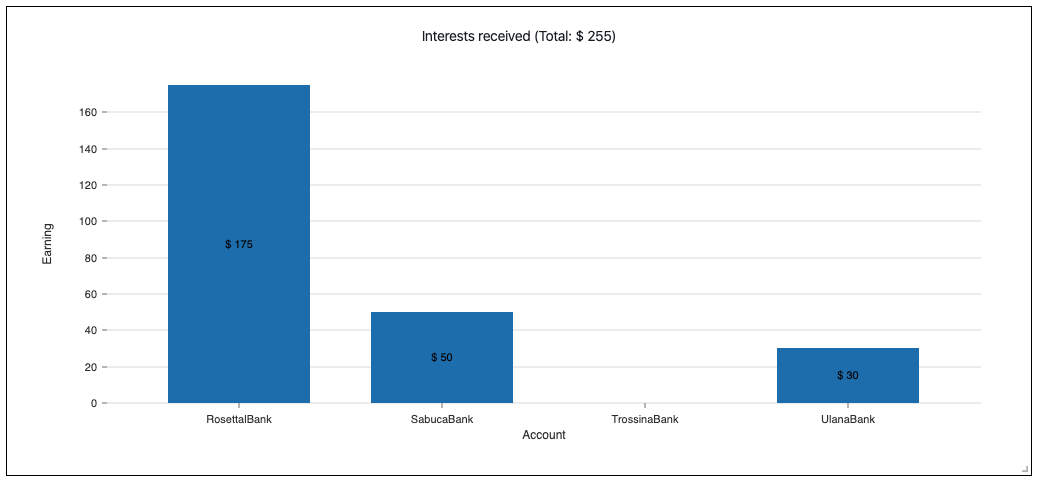
Interests received

This chart shows you the interest received for each savings account. The interest income needs to be credited to the corresponding interest income account (default:Interest:Income:*). See sample below for more info.
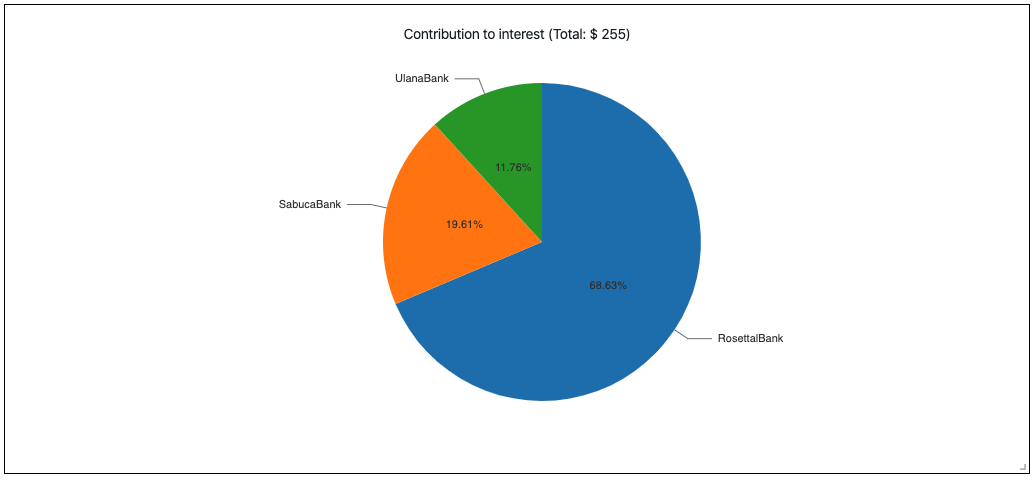
Contribution to interest

This chart shows how each of the interest income received contributes to the overall interest received. Here, we see that interest from RosettaBank makes up 68.63% of all interest received.
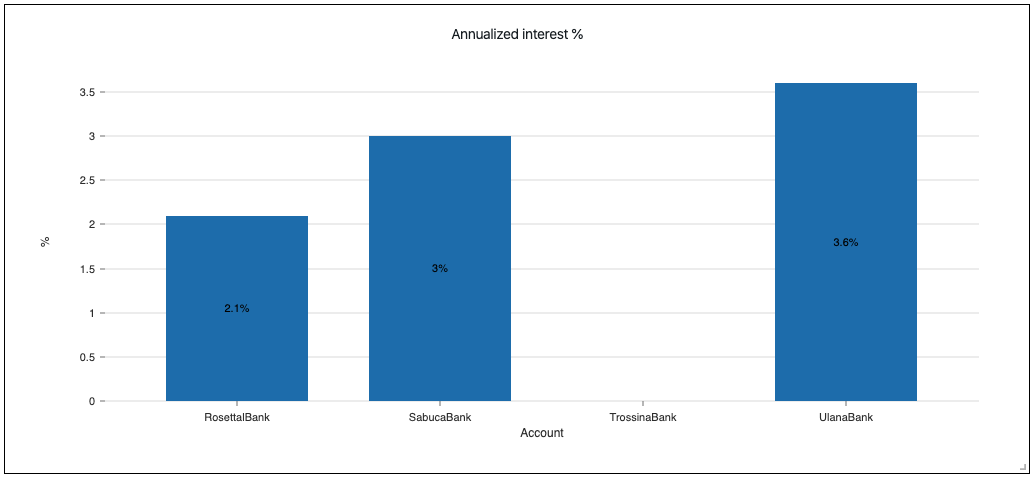
Annualized received

This chart shows the annualized interest received for each savings account in % form. This is useful to check the actual interest rate that is achieved by each savings account defined in a way that is conventional for interest rates (annualized).
Sample journal
The summary and detailed charts above can be reproduced in your Prudent client locally with this sample journal (with settings file, to be placed together in the same directory).
Usefulness
The overall interest summary provides a quick high-level overview of the interest performance of your savings whereas the detailed view shows this for each savings account.
Going through the detailed view, you can potentially identify areas that can be optimised. There are many scenarios that looking at each chart or a combination of charts can help make things better.
For example, with the Savings balances view, you can see if your savings are distributed evenly among the savings accounts or has clustered around a couple of banks or less. This may trigger some thoughts around the reasons for a cluster, especially if there are limits to which savings are insured in a particular bank (distributing the risk may be desirable).
Looking at the Interest received view, you can identify banks that gives poor interest returns and take action to move the funds saved or reclassify the account as a current account (for which interest return is not the objective).
Contribution to interest shows where the interests are coming from. This may not necessarily correspond to the amount saved and further enforces the performance of each savings account as you go thorough the charts.
Lastly, the Annualized interest provides straight to the point and immediately actionable performance differences in % form. This differs from the Interest received view as different weightings are applied, giving different perspectives to the same reality.
