Expenses vs Envelope budgeting
Envelope is an analytics extension that provides contextual visualization of your expenses vs your budget.
Defining a budget
Here's an example monthly budget of $800 for groceries and $320 for petrol.
~ Monthly
    Expenses:Groceries  $800
    Expenses:Petrol  $320
    Assets
Expense transactions
Here's a bunch of example expense transactions that leads to the first 3 charts in the Detailed View section of this document:
2021/01/03
  Assets:Savings  -$110
  Expenses:Groceries

2021/01/10
  Assets:Savings  -$125
  Expenses:Groceries

2021/01/17
  Assets:Savings  -$180
  Expenses:Groceries

2021/01/24
  Assets:Savings  -$160
  Expenses:Groceries

2021/01/31
  Assets:Savings  -$75
  Expenses:Groceries

2021/01/03
  Assets:Savings  -$90
  Expenses:Petrol

2021/01/10
  Assets:Savings  -$85
  Expenses:Petrol

2021/01/17
  Assets:Savings  -$80
  Expenses:Petrol

2021/01/24
  Assets:Savings  -$95
  Expenses:Petrol

2021/01/31
  Assets:Savings  -$75
  Expenses:Petrol
Detailed view
There are four charts in the Expenses vs Envelope budgeting detailed view.
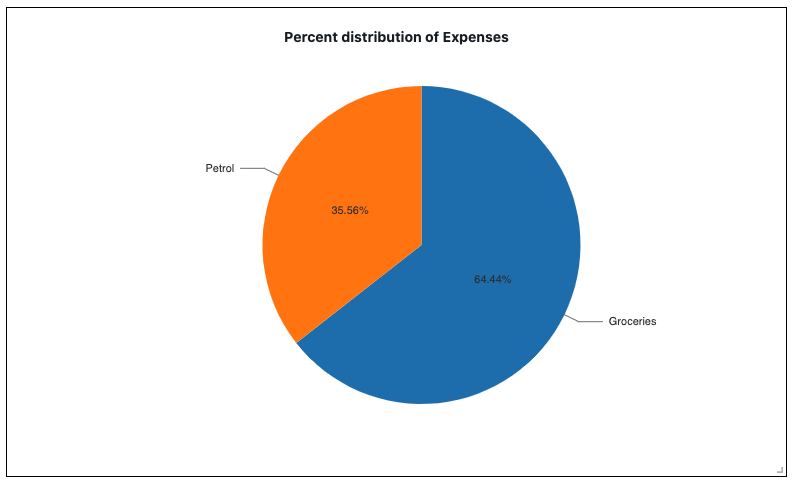
The first one shows you the percentage of expenses for the particular month:
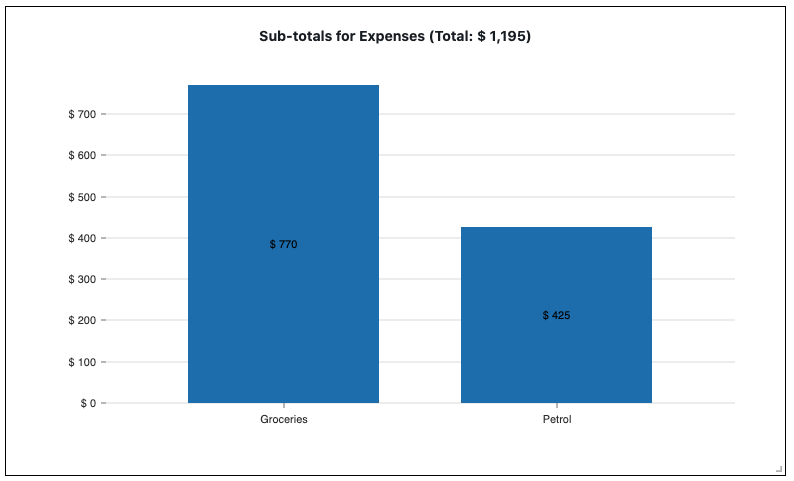
The second chart shows the sub-total of each expense:
The third chart shows the amount that is left in each envelop (budget) that you'd defined:
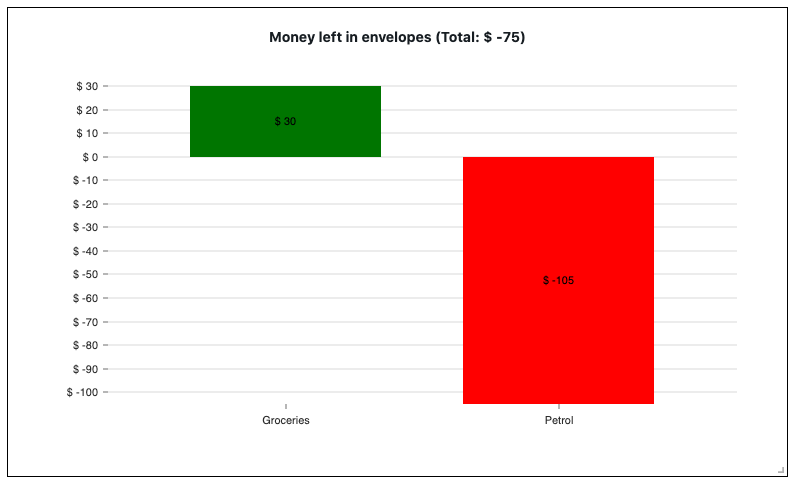
The above chart is based on the budget we defined in the example earlier. The budget we set for groceries was $800 and $770 was spent for groceries within the month, giving a balance in the envelope of $30 in the Groceries envelope. Petrol expenses exceeded the budget by $105 and is marked in red because of that.
The last chart shows the expense transactions that had occured for the month:
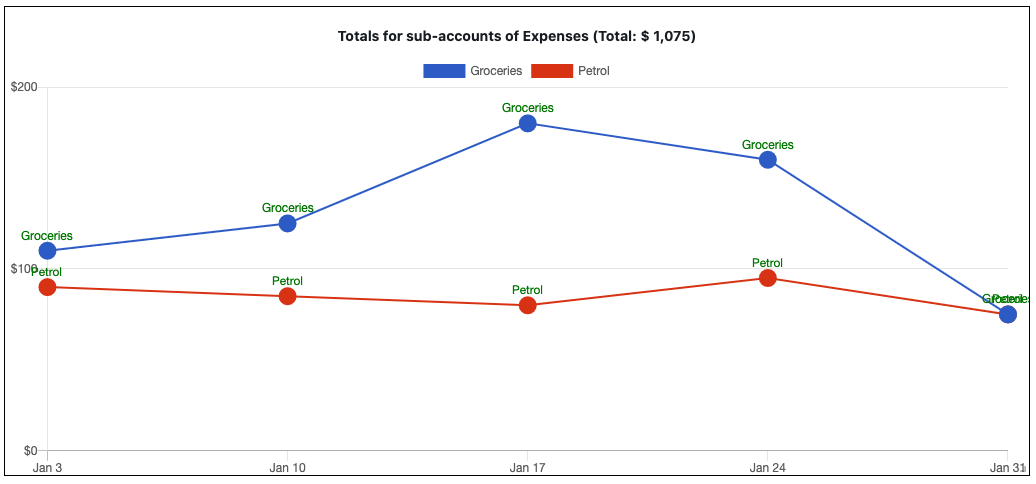
This chart is useful when setting budget, when viewed on a Year time scope (click on the Year button near the top-right):
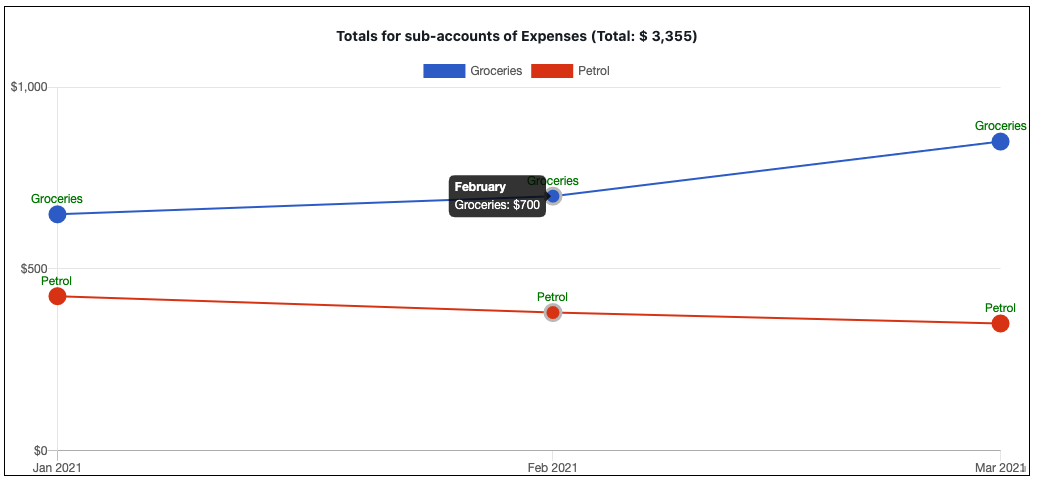
In the above chart, we see that expenses hovers around $700 for groceries and $480 for petrol. We can set our budget based on the average that we see here or any other trend (down or up) that the chart might show.
Additional transaction examples
The last expenses chart above can be reproduced with these additional transactions (on top of the other transactions shown above):
2021/02/10
  Assets:Savings  -$700
  Expenses:Groceries

2021/02/10
  Assets:Savings  -$380
  Expenses:Petrol

2021/03/10
  Assets:Savings  -$850
  Expenses:Groceries

2021/03/10
  Assets:Savings  -$350
  Expenses:Petrol
Sample journal
The detailed charts above can be reproduced in your Prudent client locally with this sample journal.